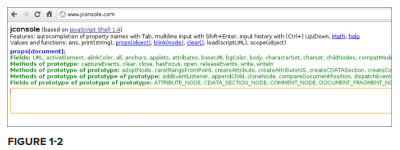
You have several tools at your disposal for developing JavaScript and jQuery, other than the traditional editor/browser setup. If your style of development is more command-line-oriented, you have jconsole and Rhino. jconsole is a web application that enables you to interactively enter JavaScript code. It comes with a few additional functions such as print(), load(), and clear(). Multiple line entries are allowed by pressing Ctrl+Enter after each line. Pressing Enter executes the current code in the text area. jconsole also maintains a history of entered commands, which is accessed by pressing the up or down arrows to use the previous and next entered commands. Figure 1-1 shows jconsole in action.
To load jQuery into jconsole use the load() function with a CDN URL. For example:
load(‘https://ajax.googleapis.com/ajax/libs/jquery/1.5.1/jquery.min.js’);
$(document).click(function(){ alert(‘It worked!’); });
jconsole also has a tab autocompletion feature, and the ability to dynamically change the execution context by entering the scope() function. For quickly testing small bits of code, jconsole really is priceless.
You probably picked up this book for using jQuery in a browser environment, but it’s also possible to use jQuery on the server. Mozilla Rhino is a JavaScript interpreter implemented in Java. It’s commonly used to embed JavaScript into Java applications. It features a JavaScript shell, debugger, and compiler. Along with the framework Envjs, also written by the jQuery creator John Resig, it’s possible to use jQuery in a server environment. Envjs is a portable JavaScript implementation of a “headless browser,” or browser that lacks a user interface that provides a scripting environment.
It’s possible to get the same effect with other host environments, such as Google V8, but I’ll stick to Rhino for this example.
Table 1-4 lists the dependencies for getting up and running with jQuery and Rhino.
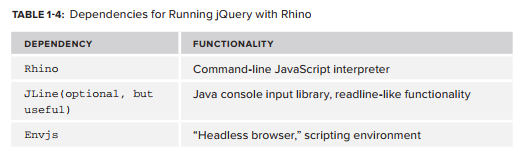
To get readline-like functionality, run Rhino with the JLine library. This way you can access the history of commands by pressing the up arrow, and edit entered characters with left and right arrow keys. The following code block shows how to get started with JLine.
java -cp js.jar:jline.jar jline.ConsoleRunner \
org.mozilla.javascript.tools.shell.Main -opt -1
The following session demonstrates how to get jQuery running with Rhino. Lines with js> indicate input.
js> load(‘env.rhino.1.2.js’);
[ Envjs/1.6 (Rhino; U; Linux i386 2.6.24-25-generic; en-US; rv:1.7.0.rc2)
Resig/20070309 PilotFish/1.2.13 ]
js> window.location = “http://localhost”
http://localhost
js> load(‘jquery.js’);
js> jQuery
function (selector, context) {
return new jQuery.fn.init(selector, context);
}
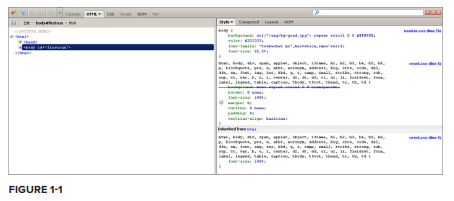
Back in the regular browser world, Firefox also has plugins for simplifying your life as a developer. One of the most popular is Firebug, a debugging tool for web development. Firebug enables live editing of HTML and CSS, debugging, and monitoring of web applications. Figure 1-2 shows the Firebug interface.
To install Firebug, go to Tools Add Ons on the menu bar, click Get Add Ons on the resulting dialog, and search for Firebug. Click Add to Firefox. After installing, you’ll notice a bug icon at the bottom right of the window. Click it to open the Firebug explorer.
You’ll notice Firebug includes six tabs: Console, HTML, CSS, Script, DOM, and .NET. Each tab contains features to simplify your life as a web developer.
The Console tab provides an output interface for viewing warning and error messages, logs, debugging information, general info, and XmlHttp Request and response objects.
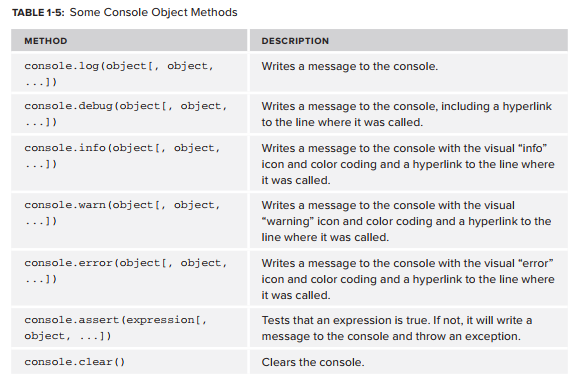
Firebug loads into the global namespace an object called console. Use this object to log console messages of the inner workings of your application. The console object contains several methods, which you can check out at http://getfirebug.com/wiki/index.php/Console_API. Table 1-5 lists a small subset of the methods contained by the console object with descriptions provided by the Firebug Wiki.
The profiler is used for performance analysis of your application. Profiling is as simple as clicking a button. Load your page, click the Profile button under the Console tab, use your application for a while, and click the Profile button again to generate a report.
The HTML tab enables you to peruse the DOM and edit HTML code “on the fly.” The tags are displayed in a tree widget, which expands to show the children of each node. The CSS tab also enables editing of styles and layout, while neatly displaying the values of each cascading style sheet.
Perhaps one of Firebug’s most useful features is the interactive command line, which allows execution of JavaScript code in the context of the web page you’re developing. There’s no need to manually load jQuery and other dependencies. The console also has command completion. The Script tab also has the ability to add/remove breakpoints, view stack traces, and watch variable values over time.
It’s also possible to use Firebug with other browsers via Firebug Lite. To do so, include in your HTML file a script tag that links to the .js file online:
<script src=”https://getfirebug.com/firebug-lite.js”></script>
Along with Firebug, Live HTTP Headers, another Firefox plugin, gives a nice rounded view of the data flowing in and about your application. The “Live” means that the HTTP header information is displayed in real time.
To install, follow the same procedure you used for Firebug. After installing, you can access Live HTTP Headers from the menu bar by selecting Tools ➪
Live HTTP Headers. A dialog displays the get requests with all kinds of useful debug information such as server type, encoding type, cookies, host, and so on. The replay feature enables you to edit request headers and resend a URL, great for debugging Ajax.
When trying to load JSON data directly from Firefox, the default behavior of the browser is to give you a Download File dialog. Using the JSONView extension Firefox will interpret and display JSON data in a nice legible manner. Furthermore, the nodes are collapsible, similar to when Firefox interprets XML data directly. For example, say you have the following .json file:
{
“users”: {
“user”: [{
“name”:”Tom”,
“email”:”tom@bigcorp.com”,
“role”:”admin”
},
{
“name”:”Nick”,
“email”:”nick@bigcorp.com”,
“role”:”employee”
},
{
“name”:”Lynn”,
“email”:”lynn@bigcorp.com”,
“role”:”manager”
},
{
“name”:”Carol”,
“email”:”carol@bigcorp.com”,
“role”:”manager”
}]
}
}
With JSONView, the output should look similar to the following code snippet. The minus sign indicates a collapsible node, and a plus sign indicates an already collapsed node. The last two records are collapsed.
{
– users: {
– user: [
– {
name: “Tom”,
email: “tom@bigcorp.com”,
role: “admin”
},
– {
name: “Nick”,
email: “nick@bigcorp.com”,
role: “admin”
},
+ { … },
+ { … }
]
}
}name: “Lynn”email: “lynn@bigcorp.com”
role: “manager”
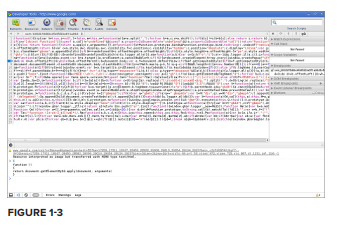
Google Chrome also offers a top-notch development environment. A set of developer tools comes by default with Chrome. These are in active development, so the feature set is constantly evolving and improving. The Chrome Developer Tools come with all the same goodies as Firebug: an interactive command line, element inspector, the ability to add/remove breakpoints, and so on. To access the developer tools press Shift+Ctrl+I.
Figure 1-3 shows the Chrome Developer Tools.
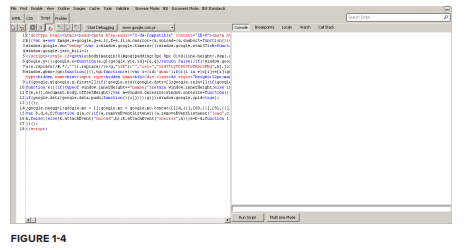
Microsoft, never one to be left behind, includes its own set of development tools with Internet Explorer, although not as complete as Firefox’s plugins and extensions. They’re called the F12 Developer Tools, which is a handy reminder of the key needed to access them. The F12 Developer Tools are quite similar to Chrome’s Inspector and Firebug’s. Figure 1-4 shows Internet Explorer’s F12.
Another essential tool is JSLint, the “JavaScript code quality tool,” which checks and validates code. Douglas Crockford explains it best: “JSLint takes a JavaScript source and scans it. If it finds a problem, it returns a message describing the problem and an approximate location within the source.” Just like jconsole, there’s a convenient web application for validating your JavaScript code; see www.jslint.com. Optionally, clone the source from Github at https://github.com/douglascrockford/JSLint.git. In the source code you’ll find fulljslint.js, which you can run outside of a web browser. Using Mozilla Rhino, you can use a short script for validating JavaScript/ jQuery code from a command line.
load(‘JSLint/fulljslint.js’);
var src = readFile(arguments[0]);
var passes = JSLINT(src);
print(passes ? ’Passes Lint Validation’ : ‘Failed Validation’);
The functions load(), readFile(), and print() are Rhino-specific functions. The load() function takes the input string pointing to the fulljslint.js file, loads the code into memory, and executes it giving you access to the JSLINT() function. The readFile() function obtains the first parameter passed in from the command line, using the arguments array, and reads the source into a string. The jslint() function then validates the content of the src variable, and returns a Boolean object signaling whether or not the string validated. With a ternary operator a message is then printed to the console depending on whether the file read passed validation. Open a terminal, and try validating a simple JavaScript file:
$ rhino runLint.js test.js
Passes Lint Validation
If the above seems like too much work, you can also take a look at the project, jslint4java at http://code.google.com/pZjslint4java/, which simplifies the command to the single line seen in the following code snippet.
$ java -jar jslint4java-1.4.jar test.js
In addition to JSLint, there’s an alternative code quality tool that’s gaining popularity, JSHint www.jshint.com/. Originally forked from JSLint in order to create a more configurable version of JSLint that didn’t enforce one particular coding style, JSHint has grown into a project of its own, with its own goals and ideals. If you find yourself running up against specific, non-configurable rules in JSLint or merely want to try out an alternative then JSHint might be a good option for you.
Finally, after finishing development of any modules or plugins, and validating using JSLint, you’ll probably want to minify your .js files for production. Several options are available on the market, but I’ll just discuss a few. Some popular open source options are the YUI Compressor, the Google Closure Compiler, UglifyJS, and JSMin. YUI Compressor offers the additional ability to minify CSS alongside your JS. While it is convenient to have one-stop shopping for all of your minification needs, the two dominant choices right now are UglifyJS, a NodeJS-based utility, and Google’s Closure Compiler. Both are in use at major JavaScript performance-obsessed projects. UglifyJS is the minifier of choice for the jQuery project itself and the Java-based Closure Compiler is the minification choice for HTML5 Boilerplate http://html5boilerplate.com. Both can be run from the command line, which allows you to automate this minification process alongside any JSLint tests you may also be running. The HTML5 Boilerplate project offers a full-featured Ant build script which does both minification and JSLint or JSHint tests (and more).
If you’re interested in getting your hands dirty, the following code samples show how easy it is to run both UglifyJS and Closure Compiler from the command line.
Assuming you’re running NodeJS, installing UglifyJS is as simple as the following:
npm install -g uglify-js
Running it is as simple as calling UglifyJS, setting the -o (output) flag, and setting an output filename and passing in the input filename to be mininfied:
uglifyjs -o app.min.js app.js
Using Closure Compiler is also very simple. Simply download the latest jar from http://closure-compiler.googlecode.com/files/compiler-latest.zip, unzip it and then run the following from the command line. It follows a similar pattern with an input file and an output file provided as command line arguments.
java -jar compiler.jar –js app.js –js_output_file app.min.js
If you aren’t a guru, or don’t understand how to use a command line, don’t sweat it. There are the web-based applications to get the same results.
Source: Otero Cesar, Rob Larsen (2012), Professional jQuery, John Wiley & Sons, Inc