When applying a computer to a task or writing a program to deal with a type of data that seems to be non-numeric, the issue of how to represent the data on the computer invariably arises. Everything stored and manipulated on a computer has to be a number. What if the data is not numeric?
A fundamental example of this is character data. When a user types at the computer keyboard, what actually happens? Each key, and some key combinations (e.g., the shift key and “1” held down at the same time), when pressed result in electrical signals being sent along a set of wires that connect to an input device on the computer, a USB port perhaps. Pressing a key results in an identifiable combination of wires being given a voltage. This is, in fact, a representation of the character, and one that underlies the one that will be used on the computer itself. As described previously, voltages can be used to represent binary numbers.
The representation of characters on a computer amounts to an assignment of a number to each possible character. This assignment could be arbitrary, and for some data it is. The value of the letter “a” could be 1, “b” could be 12, and “c” could be 6. This would work, but it would be a poor representation because characters are not in an arbitrary order. The letter “b” should be between “a” and “c” in value because it is positioned there in the data set, the set of characters. In any case, when creating a numeric representation the first rule is as follows:
- If there are a relatively small number of individual data items, assign them consecutive values starting at 0. If there is a practical reason to start at some other number, then do so.
The second rule considers the existing ordering of the elements:
- In cases where data items are assigned consecutive values, assign them in a manner that maintains any pre-defined order of the elements.
This means that in a definition of characters the letter ‘a’, ‘b’, and ‘c’ should appear in that order.
- In cases where data items are assigned consecutive values, assign them in a manner that maintains any pre-existing distance between the elements.
This means that the letters “a,” “b,” and “c” would be adjacent to each other in the numeric representation because they are next to each other in the alphabet. The character classes also have consecutive codes so that the code for “0” is adjacent to, and smaller than, the code for “1,” and so on. This set of three rules creates a reliable mapping of characters to numbers. However, there are more rules for making representations.
- In cases where the data items are assigned consecutive values, assign them in a manner that simplifies the operations that are likely to be performed on the data.
In the present example of character data, there are relatively few places where this rule can be invoked, but one would be when comparing characters to each other. A character “A” is usually thought to come before “a,” so this means that all of the uppercase letters come before all lowercase ones, in a numerical sense. Similarly, “0” comes before “A,” so all digits come before all letters in the representation. A space would come before (i.e., have a smaller value) than any character that prints.
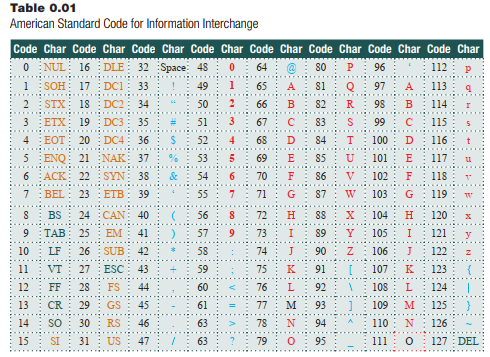
One of the most common character representations, named the American Standard Code for Information Interchange or ASCII has all of these properties, and a few others. The standard ASCII character set lists 128 characters with numerical codes from 0 to 127. In the table below, each character is listed with the code that represents it. They appear in numerical order. The characters in orange are telecommunications characters that are never used by a typical computer user; green characters are non-printing characters that are used for formatting text on a page; letters and numbers for English are red; special characters, like punctuation, are blue. The space character is in some sense unique, and it is black.
If there is a very large number of possible data values, then enumerating them would be unreasonable. There are other ways to solve that sort of problem.
- Try to break the data into enumerable parts.
Dates can be an example of this kind of data. There are too many dates to store as discrete values, as there is no actual day 0, and there is no practical final day in the general case. However, a common way to state a date is to give a year, a month, and a day. This is awkward from a computer’s perspective because of the variable number of days in each month, but it works well for humans. Each component is enumerable, so a possible representation for a date would be as three numbers: year, month, day. It would be YYYYMMDD, where YYYY is a four-digit year, MM is a number between 0 (January) and 11 (December), and DD is a number between 0 and 30, which is the day of the month.
This representation should keep the dates in the correct sequence, so December 9, 1957, (19571108) comes after Aug 24, 1955 (19550723). However, another common operation on dates is to find the number of days between two specified dates. This is difficult, and the only representation that would simplify it would be to start counting days at a zero point. If that zero point is Jan 1, 1900 then the representation for the date October 31, 2017 is 43037. The number of days between two dates is then found by subtraction. However, printing the date in a form for humans to read is difficult. When selecting a representation, the most common operations on the data should be the easiest ones to perform. Another example of this sort or representation is color, which will be discussed in detail in a later chapter.
- When the data is part of a continuous stream of real values, then it may be possible to sample them and/or quantize them.
Sampling means to represent a sequence by using a subset of the values.
Imagine a set of numbers coming from a seismometer. The number sequence represents measurements of the motion of the ground captured continuously by a mechanical device. It is normally acceptable to ignore some of these values, knowing that between a value of 5.1 (whatever that means) and a value of 6.3, the numbers would have taken on all possible values between those two; that’s what continuous means.
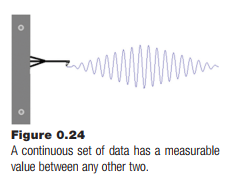
Instead of capturing an infinite number of values, which is not possible, why not capture a value every second, or tenth of a second, or at whatever interval makes sense for the data concerned? Some data will be lost. The important thing is not to lose anything valuable.
The same thing can be done spatially. If someone is building a road, then it must be surveyed. A set of height values for points along the area to be occupied by the road is collected so that a model of the 3D region can be built. But between any two points that can be sampled there is another point that could be sampled, on to infinity.
Again, a decision is made to limit the number of samples so that the measurements are made every few yards. This limits the accuracy, but not in a practical way. The height at some specific point may not have been measured, but it can be estimated from the numbers around it.
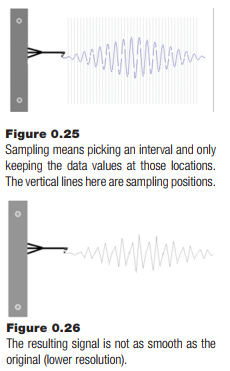
The distance between two sample points is referred to as the resolution. In spatial sampling, it is expressed in distance units, and says something about the smallest thing that can be precisely known. In time sampling, it is expressed in seconds.
Quantization means how accurately each measurement is known. In high school science, numbers that are measurements are given to some number of significant figures. Measuring a weight as 110.9881 pounds would seem impossibly accurate, and 111 would be a more reasonable number. Quantization in computer terms would be restricting the number of bits used to represent the value. Something that is stored as an 8-bit number can have 256 distinct values, for example. If the world’s tallest person is under 8 feet tall, then using 8 bits to represent height would mean that 8 feet would be broken up into 256 parts, which is 0.375 inches; that is 8 feet x 12 inches/foot = 96 inches, and dividing this into 256 parts =0.375. The smallest difference in height that could be expressed would be this value, a little over a third of an inch.
Quantization is reflected in the representation as a possible error in each value. The greater the number of bits per sample, the more accurately each one is represented. The use of sampling and quantization is very common, and is used when saving sounds (MP3), images (JPEG), and videos (AVI).
There are other possible options for creating a representation for data, but the six basic ideas here will work most of the time, alone or in combination. A programmer must understand that she or he will need to wisely choose the representations for the data. A poor choice will result in more complex code, which generates more errors and less overall satisfaction with the result. Spending a little extra time at the beginning analyzing the possibilities can save a lot of effort later.
Source: Parker James R. (2021), Python: An Introduction to Programming, Mercury Learning and Information; Second edition.